Comm Post-Testing
2025 | Product Design Lead
Project Objective
A month after the Comm program launched, the Comm design team conducted qualitative and quantitative tests to assess how users were responding to the new program.
Methodology
Critical Incident Technique. A technique used by the United States Air Force and adapted for UX Research. It’s initial use was to evaluate errors made by wartime aviators, but it can also be useful for UX Research. The main con of using this method is it relies heavily on recall. A large pro of using this method is it tends to bring out the best and the worst aspects of the user experience.
Qualitative Research
The System Usability Survey is a tried and true UX Research method. The Systems Usability Survey (SUS) is a 10 question survey that helps measure the usability of the product by assigning it a score. This score can be kept for future reference and also used to compare against competitors scores.
Quantitative Research
Participants
Active users of the Comm program
Before the launch of Comm, there was a previous Comm program. Balance of Nature had been using this program for a while before the launch of this new Comm program (Comm 2.0) This being the case, there where (and still are) many active users in this program. We were able to get volunteer participants from this pool of candidates.
Findings
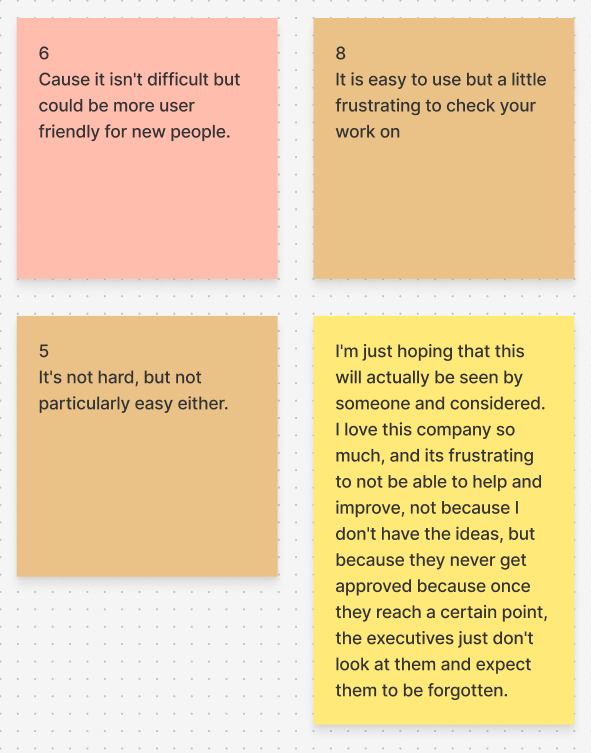
The SUS survey brought some performance issues to the surface that we had been unaware of before. The program was slow to load, users wanted to be able to copy and paste from the CSW section, users were having a hard time with certain interfaces (stats screens), and there was a demand for a ‘stats by condition’ screen.
There was some great feedback from the CIT Interviews. We were surprised to find that some of the microcopy was leaving users scratching their heads. “Is this CSW Financial”. This checkbox at the end of the CSW had many people confused. One instance of confusion over microcopy was tied in with creating the stats. When you create a stat, you are able to go in and define the lifecycle of the stat. The copy read ‘First day’. Some users struggled to understand this and how lifecycles worked within the program.
Our research was able to uncover various actionable findings. The results demonstrated how far the program had come since the previous application (Comm 1.0) and also unearthed a few areas of opportunity.
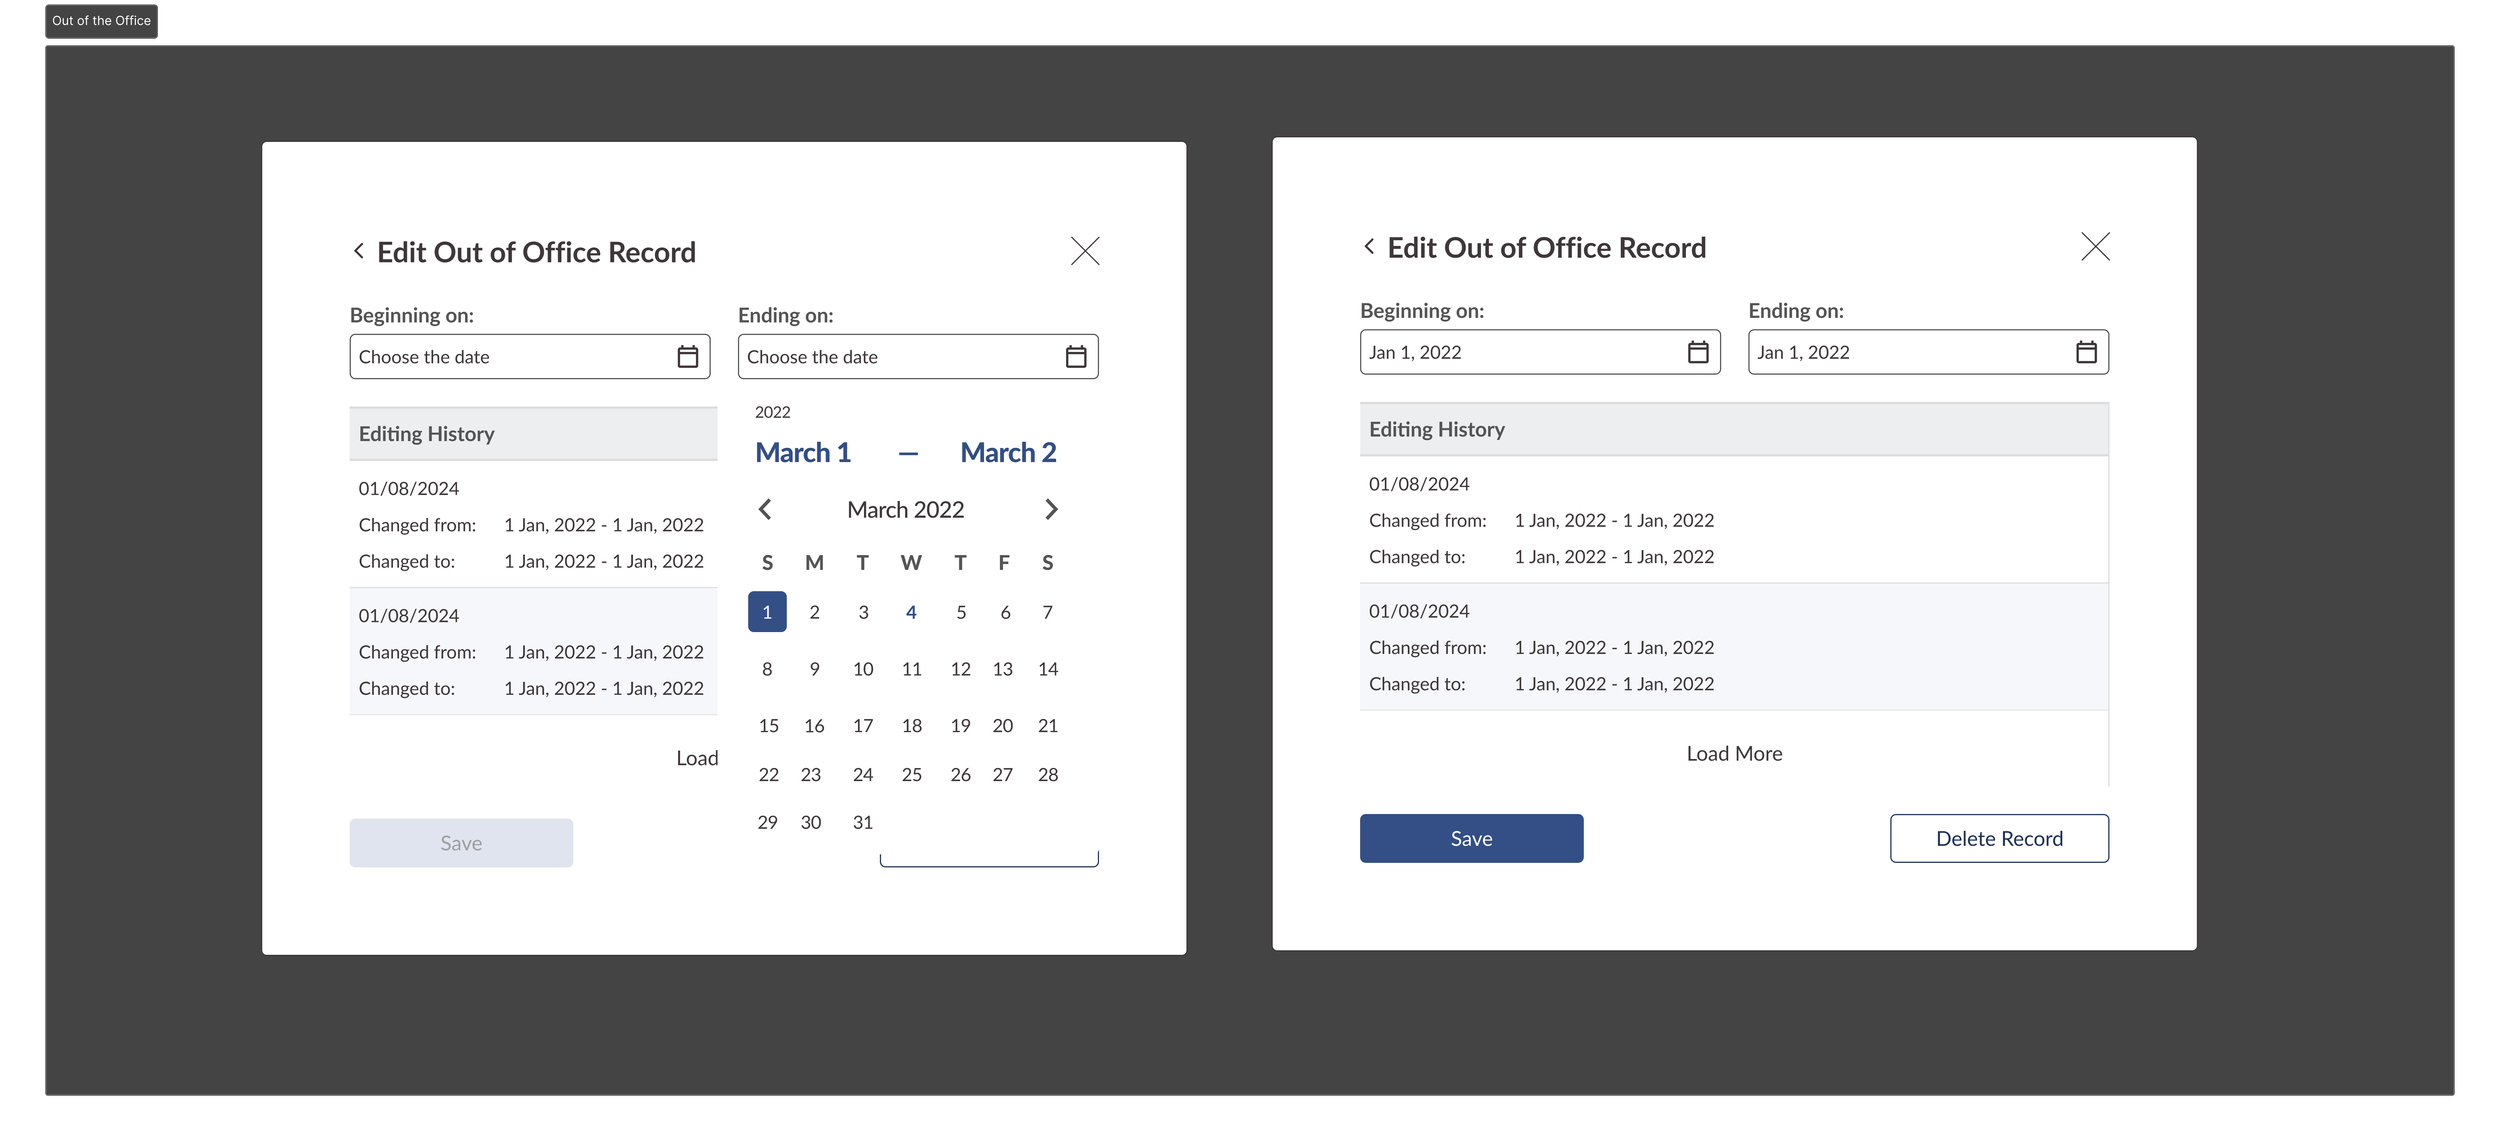
The Out of the Office feature request was built later that year.
Another feature request that we received was the ability to log time out of the office in the Comm program. As it stood, if you took a vacation, your stats would plummet. This didn’t reflect the reality of the situation; you had nothing to report, but only because you were on vacation. Not because you weren’t productive.
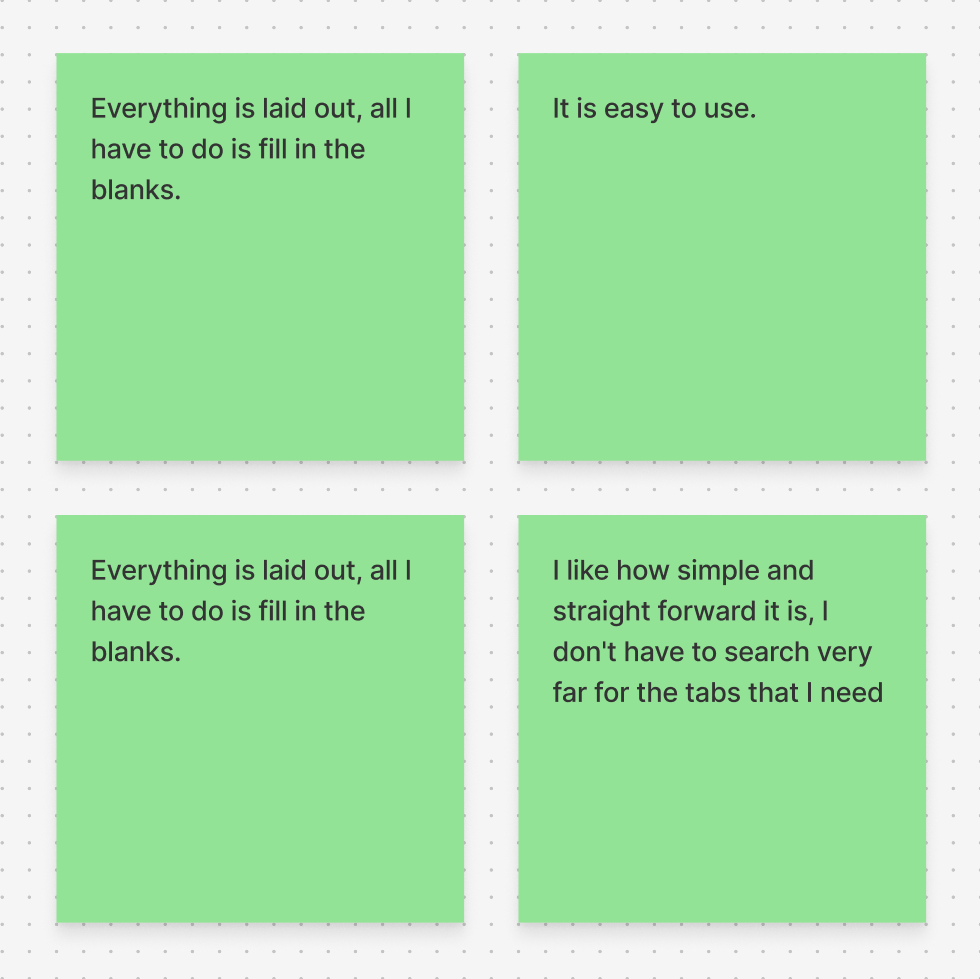
Users found this new version of Comm both easier to understand and easier to use. Users appreciated that the Stats and Formulas were separated now (They were tied together in the previous application; You would need to finish both tasks at the same time or start over). Users stated that the overall experience of the application had vastly improved since the last program. One user stated that the difference was “Night and Day”.
Number of Participants: 33
SUS Results
Number of Participants: 5
Score: 67.05 (D+)
Whether you’re a Designer, Developer, or a Stakeholder, a D+ on a usability survey will leave you wanting better for your project. The good news is once you’ve recorded a score, you now have a metric that you can improve upon and track over time.
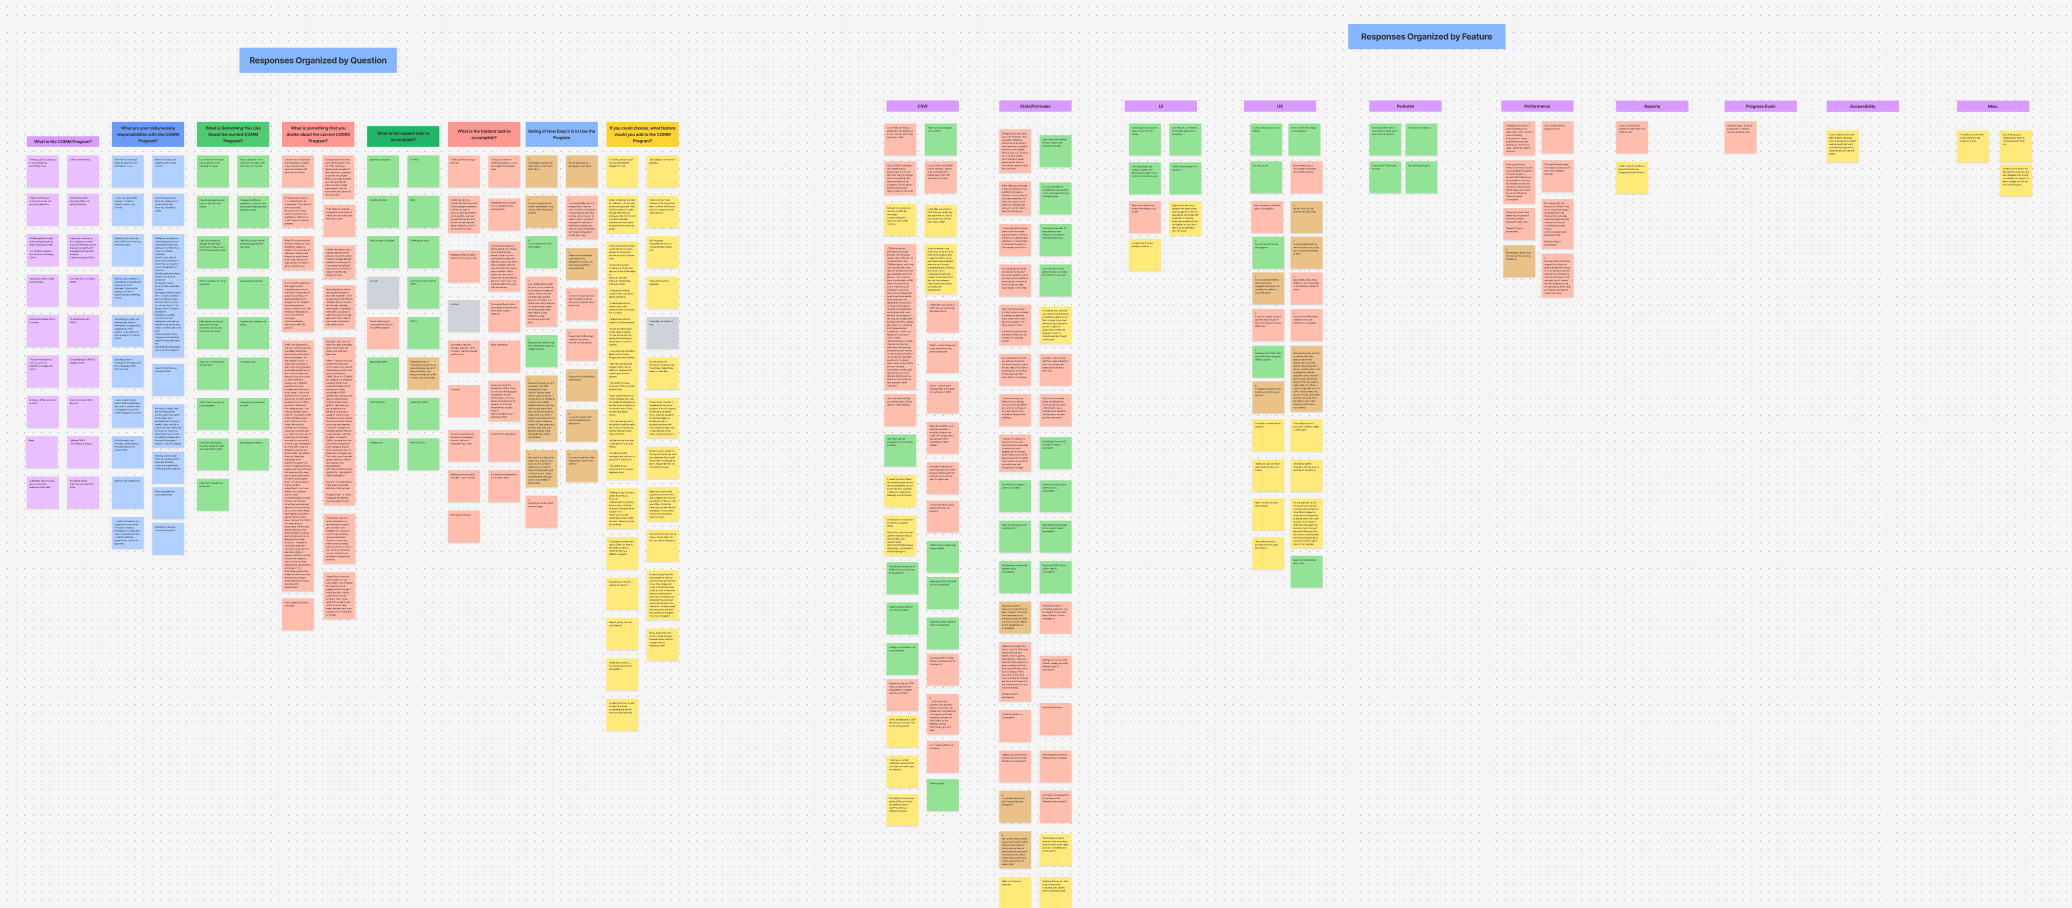
Affinity Map from the SUS comment section
Opportunities
Wins
We need to make Comm easier to understand and use
Pain points are out there; every time we look, we learn more about our users and their unique use cases
We need to highlight our users voices more often
Clarity on processes is in high demand
CIT Results
The results from the CIT Interviews reinforced feedback that we had received from the quantitative survey. There where many areas of Comm that loaded slowly and where buggy in the first few months after launch (not to say that there isn’t still improvement to make today; the devs have improved the load times considerably). One of the major findings was users were having a difficult time understanding when something was due in contrast to other items nearby (stats and formulas next to the overdue ones). This particular item is one that the team is scheduled to work on in early 2026.
Pain Points
The design on the ‘My Stats’ and ‘My Formulas’ pages left a number of user confused
Auto save was not working on the Formulas
Users wanted a way to access their formula more often; they post to the dashboard on Monday, but then go away and you have to dig for them
Wins
Overall, users were satisfied with the Formulas section
The checkbox feature within the Formula was widely praised
Users were very pleased when they found that the new program had Stats and Formulas separate
Summary
Comm has plenty of room to grow. That being said the study shows that it is a major quality of life improvement over its predecessor. Users are having a much easier time keeping track of things in Comm 2.0.
A win for Comm. A win for Balance of Nature. And a step up for StarkSys’ UX maturity
Getting the opportunity to work closely with user over the post-testing period provided value to everyone involved. While we might not be able to address everything, we can tackle items that make the most impact.
The Product Team will be pushing for more user testing and continuous discovery moving forward.